
Your 12,064 Findings Are Lying to You: Counting Images, Not Reports, with the Trivy Operator
Trivy Operator emits one VulnerabilityReport per workload, not per image. Sum the reports and you double-count everything. Here is the jq that gets the real number.
The first honest number we produced about our own cluster was embarrassing — not because it was too high, but because the first number we published was wrong.

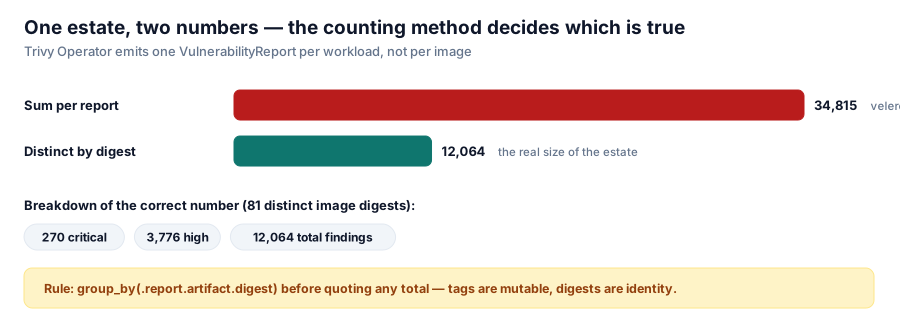
One estate, two numbers — the counting method decides which one is true.
When we started building a container image security programme, the headline metric we quoted was "~22,165 findings". It came from a straightforward aggregation over the Trivy Operator's VulnerabilityReport custom resources: sum report.summary.criticalCount, highCount, mediumCount, and so on across everything. The arithmetic was correct. The number was still wrong.
Why the total was double-counted
Trivy Operator emits one report per workload, not per image. A single image deployed into five namespaces produces five reports. A CronJob that spawns pods every hour produces a report per pod (or per owner), and short-lived CI runner pods leave throwaway reports behind.
In our case, velero/velero alone accounted for 41 of 187 reports. Every one of those 41 described the same image digest.
Summing per-report gave 34,815. De-duplicating by image digest gave 12,064 findings across 81 distinct digests — 270 critical, 3,776 high. Both numbers were in the same spreadsheet. Only one described reality.
The jq that counts correctly
Group by digest first, then aggregate the summaries of one representative report per group:
kubectl get vulnerabilityreports -A -o json | jq '
  [.items | group_by(.report.artifact.digest)[] | .[0].report.summary]
  | {critical: (map(.criticalCount)|add), high: (map(.highCount)|add)}'
If you want a worst-first inventory of distinct images rather than workloads:
kubectl get vulnerabilityreports -A -o json | jq -r '
  .items | group_by(.report.artifact.digest)[] | .[0]
  | [.report.summary.criticalCount, .report.summary.highCount,
     .report.artifact.repository] | @tsv' | sort -rn | head -20
The key is .report.artifact.digest, not repository or tag. Tags are mutable; digests are the identity of what is actually running.
Why this matters beyond dashboard accuracy
Three downstream decisions depended on that number:
- The business case. "22,000 findings" and "12,064 findings across 81 images" tell different stories about the size of the problem. One invites panic; the other invites a plan.
- Per-team attribution. Counting reports assigns findings to whoever runs a workload. Counting digests assigns them to whoever builds the image — which is who can actually fix them.
- Progress tracking. If your baseline is inflated, your reductions are inflated too. When Copacetic zeroed out the OS CVEs on one fixture image, we could trust the before/after only because the counting method was sound.
The general lesson
Any CRD that keys to a workload rather than an artifact will silently inflate aggregate dashboards. The same class of mistake shows up as:
- counting Prometheus
upsamples instead of distinct targets, - counting pod restarts instead of failing pods,
- counting CI jobs instead of distinct commits.
Before you build an argument on an aggregate, ask: what is the unit of deduplication, and is it in the query? For us it was one group_by(digest) that we skipped. It took a deliberate confidence review — someone asking "how sure are you?" — to catch it, not a pipeline failure.
Sanity-check the headline before you headline it.
Series: Building a Container Image Security Stack. Next: choosing fixtures before tools — why a distroless image and a planted secret make better evidence than a real production workload.